| Equation Grapher is a utility program that plots the graphs of entered equations. | 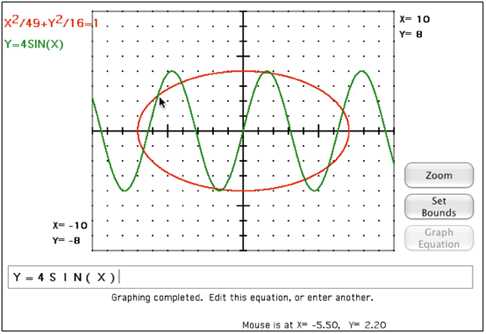 |
| Linear & Quadratic Graphs displays a graph of a certain type (line, parabola, circle, ellipse, hyperbola). The student enters an equation that matches the graph. | 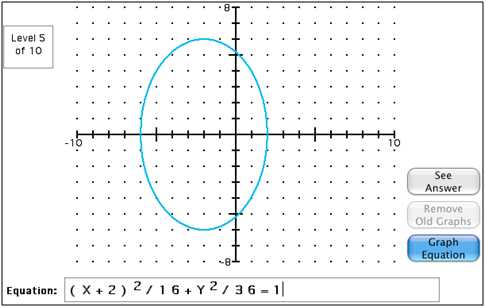 |
| Green Globs is a game in which thirteen green globs are randomly placed on the grid. Students earn points by entering equations that pass through as many green globs as possible. | 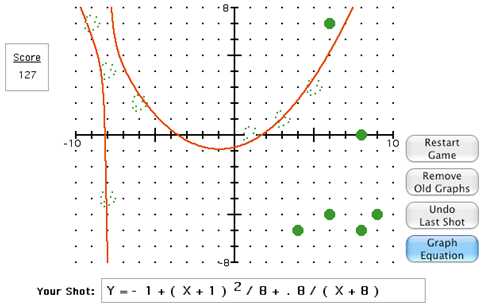 |
| Tracker is a game in which graphs are hidden on a grid. The student gathers clues to determine the equations of the hidden graphs by using “probes” (horizontal and vertical lines) to find the location of the graphs. |  |
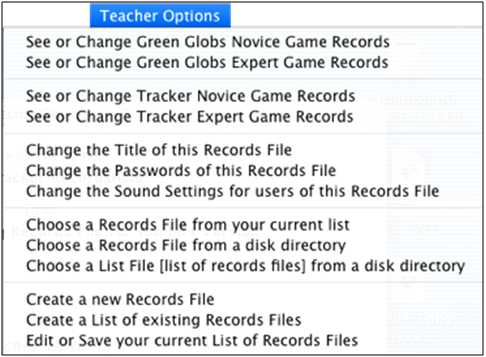
| Teacher
Options
provides tools for the teacher to manage the Records file(s). A Records file holds the top
ten scores recorded
by students playing Green Globs or Tracker
games. The PC version appends two menu items for converting Records files and List files from the previous PC version to the format of the new PC version. |
 |
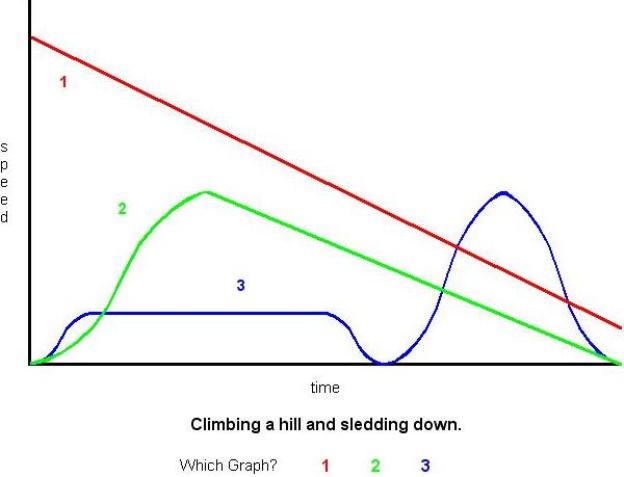
| Relating
Graphs to Events
involves interpreting line graphs qualitatively, recognizing the
general shape of the graph as it relates to the labels on the axes. In
each of twenty practice problems, three line graphs are plotted on one
set of axes. The axes are labeled to indicate which variables they
represent. The axes do not have numerical scale markings. A brief
description of a physical event is displayed below the graphs. The
student selects the graph whose shape most closely matches the
described event. |
 |
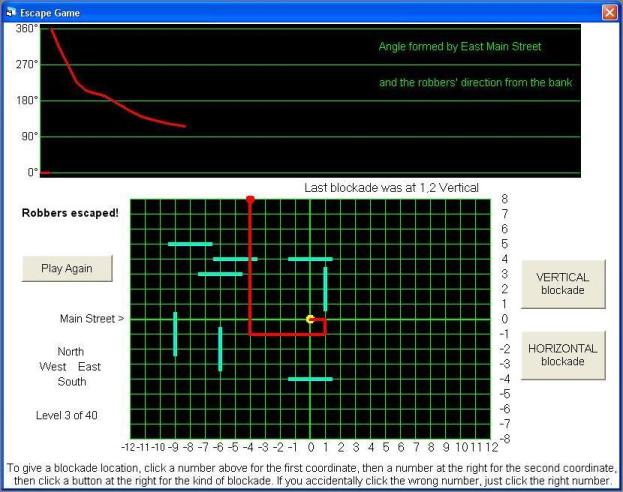
| Escape is a game in which
students use graphs as diagnostic tools,
translating changes in a graph into the related changes in an event. A
city map is represented by a rectangular coordinate grid. Bank robbers
try to escape from a bank at the center of the city to the city limits
at the edge of the grid. Students try to trap the robbers by
setting blockades. The robbers' path is not displayed until after the
game ends. Students must make blockade decisions based on information
obtained from a graph of the robbers' movements. Students choose one of
three graphs. The graph may provide only part of the information needed
to specify the robbers' position. Students must decide what the graph
tells them, what it does not tell them, when and what to estimate, when
specific function values are important, and how to use this information
to set blockades. |
 |